Now let’s look at a still more complicated example. For this example, we want to create a demographics table that can be used across multiple studies. Therefore, we’ll need to let the user pass in parameters like treatment groups, the path to the data, and which variables to include in the analysis. The macro package makes it easy to create such a parameterized table.
Generate a Demographics Table
To generate the table, we will need four files:
- A macro driver script
- A template table program
- A sample data code snippet
- A report code snippet
Macro Driver Script
In this example, we will assign macro parameters using
symput(). This is yet a third way to pass parameters into a
template program:
#####################################
# Assign Macro Variables
#####################################

# Assign base path
symput("base_path", "c:/packages/macro/tests/testthat/examples")

# Assign relative paths
symput("log_path", "&base_path/log")
symput("output_path", "&base_path/output")
symput("template_path", "&base_path/templates")
symput("data_path", "&base_path/data")

# Assign global variables
symput("sponsor_name", "Acme, Inc.")
symput("study_name", "ABC")
symput("prog_name", "t_dm")

# Select analysis variables
symput("vars", c("AGE", "AGEG", "SEX", "RACE"))
symput("anals", c("cont", "cat", "cat", "cat"))
symput("lbls", c("Age", "Age Group", "Sex", "Race"))

# Assign or get titles
symput("titles", c("Table 1.0",
                   "Analysis of Demographic Characteristics",
                   "Safety Population"))

# Assign or get footnotes
symput("footnotes", c(paste0("Program: &prog_name..R"),
                      "NOTE: Denominator based on number of non-missing responses."))

# Assign treatment groups and labels
symput("trt_grps", c("ARM A" = "Placebo",
                     "ARM B" = "Drug 50mg",
                     "ARM C" = "Drug 100mg",
                     "ARM D" = "Competitor"))

# Assign other parameters
symput("env", "dev") # "prod"
symput("out_type", "PDF")

# Assign preview
symput("preview", ", preview = 1")

# Preprocess and Run Example3
macro::msource(paste0(symget("base_path"), "/templates/dm01.R"),
               paste0(symget("base_path"), "/code/t_dm.R"),
               debug = TRUE, symbolgen = TRUE, clear = FALSE)
Note the following in the above driver:
- The
symput()function is a clean approach to passing macro parameters into a template program. You can gather macro variable values from metadata or utility functions and easily pass them intosymput(). - The macro variables set using
symput()can be used to construct other macro variables. They will be resolved normally during pre-processing. - If you need a macro variable value immediately, you can use the
symget()function to retrieve it from the symbol table. - The above approach also allows you to execute
msource()directly from the driver script. You can run this script from the “Source” or “Run” button in your development environment. - The above call to
msource()includes thedebug = TRUEandsymbolgen = TRUEparameters. The debug information will be shown below. - The above call to
msource()also setsclear = FALSEso the macro variables you set withsymput()do not get wiped out whenmsource()runs.
Observe that there are four possible analysis variables for this demographics table: “age”, “ageg”, “sex”, and “race”. The program allows the user to pick which variables will be added to the final report. The template table program will only output code for the selected analysis variables.
Template Table Program
Here is the macro-enabled template program that the above driver is calling:
#####################################################################
# Program Name: &prog_name.
# Study: &study_name.
#####################################################################

library(sassy)

# Prepare Log -------------------------------------------------------------


options("logr.autolog" = TRUE,
        "logr.on" = TRUE,
        "logr.notes" = FALSE,
        "procs.print" = FALSE)

# Assign program name
prog_nm <- "&prog_name."

# Construct paths
l_path <- file.path("&log_path.", paste0(prog_nm, ".log"))
o_path <- file.path("&output_path.", prog_nm)

# Open log
lf <- log_open(l_path)

# Prepare formats ---------------------------------------------------------

sep("Prepare formats")

put("Compile format catalog")
fc <- fcat(MEAN = "%.1f", STD = "(%.2f)",
           Q1 = "%.1f", Q3 = "%.1f",
           MIN = "%d", MAX = "%d",
           CNT = "%2d", PCT = "(%5.1f%%)")


#%if ("AGEG" %in% &vars.)

put("Age Groups")
fc$AGEG <- value(condition(x >= 18 & x <= 29, "18 to 29"),
                 condition(x >=30 & x <= 39, "30 to 39"),
                 condition(x >=40 & x <=49, "40 to 49"),
                 condition(x >= 50, ">= 50"),
                 as.factor = TRUE)
#%end

#%if ("SEX" %in% &vars.)

put("Sex decodes")
fc$SEX <- value(condition(x == "M", "Male"),
                condition(x == "F", "Female"),
                condition(TRUE, "Other"),
                as.factor = TRUE)

#%end

#%if ("RACE" %in% &vars.)

put("Race decodes")
fc$RACE <- value(condition(x == "WHITE", "White"),
                 condition(x == "BLACK OR AFRICAN AMERICAN", "Black or African American"),
                 condition(x == "ASIAN", "Asian or Pacific Islander"),
                 condition(x == "UNKNOWN", "Unknown"),
                 condition(TRUE, "Other"),
                 as.factor = TRUE)

#%end


# Load and Prepare Data ---------------------------------------------------

sep("Prepare Data")

#%if ("&env." == "prod")

put("Get data")
libname(dat, "&data_path.", "Rda")

dm <- dat$dm

#%else

put("Create sample data.")
#%include '&template_path./dat01.R'

#%end

put("Log starting dataset")
put(dm)

put("Filter out screen failure")
dm_f <- subset(dm, ARM != 'SCREEN FAILURE')


put("Get ARM population counts")
proc_freq(dm_f, tables = ARM,
          output = long,
          options = v(nopercent, nonobs)) -> arm_pop

put("Log treatment groups variable")
trt_grps <- `&trt_grps.`
put(trt_grps)

#%if ("AGEG" %in% &vars.)

put("Categorize AGE")
dm_f$AGEG <- fapply(dm_f$AGE, fc$AGEG)
#%end

#% Analysis Macros --------------------------------------------------------

#%macro anal_cont(var, lvar, lbl)
#%let blknm <- &lvar._block
# &lbl. Summary Block -------------------------------------------------------

sep("Create summary statistics for &lvar..")

put("Call means procedure to get summary statistics for &lvar.")
proc_means(dm_f, var = `&var.`,
           stats = v(n, mean, std, median, q1, q3, min, max),
           by = ARM,
           options = v(notype, nofreq)) -> `stats_&lvar.`

put("Combine stats")
datastep(stats_&lvar,
         format = fc,
         drop = find.names(stats_&lvar, start = 4),
         {
           VAR <- "&lbl."
           `Mean (SD)` <- fapply2(MEAN, STD)
           Median <- MEDIAN
           `Q1 - Q3` <- fapply2(Q1, Q3, sep = " - ")
           `Min - Max` <- fapply2(MIN, MAX, sep = " - ")

         }) -> comb_&lvar

put("Transpose ARMs into columns")
proc_transpose(comb_&lvar,
               var = names(comb_&lvar),
               copy = VAR, id = BY,
               name = LABEL) -> `&blknm`
#%mend

#%macro anal_cat(var, lvar, lbl)
#%let blknm <- &lvar._block
# &lbl. Block ---------------------------------------------------------------

sep("Create frequency counts for &lbl.")

put("Get &lvar. frequency counts")
proc_freq(dm_f,
          table = `&var.`,
          by = ARM,
          options = nonobs) -> freq_&lvar

put("Combine counts and percents and assign age group factor for sorting")
datastep(freq_&lvar,
         format = fc,
         keep = v(VAR, LABEL, BY, CNTPCT),
         {
           VAR <- "&lbl."
           CNTPCT <- fapply2(CNT, PCT)
           #%if ("&var." == "AGEG")
           LABEL <- CAT
           #%else
           LABEL <- fapply(CAT, fc$`&var.`)
           #%end
         }) -> comb_&lvar


put("Sort by &lvar. factor")
proc_sort(comb_&lvar, by = v(BY, LABEL)) -> sort_&lvar

put("Tranpose &lvar. block")
proc_transpose(sort_&lvar,
               var = CNTPCT,
               copy = VAR,
               id = BY,
               by = LABEL,
               options = noname) -> `&blknm`
#%mend

#% Get length of variable vector
#%let varcnt <- %sysfunc(length(&vars.))

# Perform Analysis  -------------------------------------------------------

#% Iterate analysis variables
#%do idx = 1 %to &varcnt.

  #%let var <- %sysfunc(&vars[&idx])
  #%let lvar <- %sysfunc(tolower("&var"))
  #%let lbl <- %sysfunc(&lbls[&idx])
  #%let anal <- %sysfunc(&anals[&idx])

  #%if ("&anal" == "cont")
    #%anal_cont(&var, &lvar, &lbl)
  #%end
  #%if ("&anal." == "cat")
    #%anal_cat(&var, &lvar, &lbl)
  #%end
#%end

# Create final data frame -------------------------------------------------

#%let blocks <- %sysfunc(paste0(tolower(&vars.), "_block", collapse = ", "))

final <- rbind(`&blocks.`)

# Report ------------------------------------------------------------------

#% Include standard report code 01
#%include '&template_path./rpt01.R'

# Clean Up ----------------------------------------------------------------
sep("Clean Up")

put("Close log")
log_close()


# Uncomment to view report
# file.show(res$modified_path)

# Uncomment to view log
# file.show(lf)
In the above code, notice the following:
- The template program includes logging from the logr package and formatting from the fmtr package.
- Several macro variables are used from the macro driver. These macro variables include the program name, treatment groups, sponsor name, study name, etc.
- Data for the program can either come from the “prod” or “dev” environment. If the environment is “dev”, sample data is used. If the environment is “prod”, a real dataset is used. The “dev” sample data comes from an included code snippet.
- Analysis variable blocks are created using functions from the procs package.
- The code for all analysis variables is divided in the continuous and categorical sections. The appropriate analysis is driven by the “&anals” macro variable. This template program can be easily extended to other analysis variables.
- The report code comes from an included template code snippet.
Template Code Snippets
Here is the template code for the sample dataset:
dm <- read.table(header = TRUE, text = '
       SUBJID  ARM    SEX  RACE    AGE
       "001"   "ARM A" "F"  "ASIAN" 19
       "002"   "ARM B" "F"  "WHITE" 21
       "003"   "ARM C" "F"  "WHITE" 23
       "004"   "ARM D" "F"  "BLACK OR AFRICAN AMERICAN" 28
       "005"   "ARM A" "M"  "WHITE" 37
       "006"   "ARM B" "M"  "WHITE" 34
       "007"   "ARM C" "M"  "ASIAN" 36
       "008"   "ARM D" "M"  "WHITE" 30
       "009"   "ARM A" "F"  "WHITE" 39
       "010"   "ARM B" "F"  "WHITE" 31
       "011"   "ARM C" "F"  "BLACK OR AFRICAN AMERICAN" 33
       "012"   "ARM D" "F"  "WHITE" 38
       "013"   "ARM A" "M"  "BLACK OR AFRICAN AMERICAN" 37
       "014"   "ARM B" "M"  "WHITE" 34
       "015"   "ARM C" "M"  "WHITE" 36
       "016"   "ARM A" "M"  "WHITE" 40')
Here is the template code for the report snippet:
sep("Create and print report")

#%if (%symexist(out_type) == FALSE)
#%let out_type <- "RTF"
#%end

# Get min and max columns
mincol <- names(trt_grps[1])
maxcol <- names(trt_grps[length(trt_grps)])

# Create Table
tbl <- create_table(final, first_row_blank = TRUE) |>
  column_defaults(from = mincol, to = maxcol, align = "center",
                  width = 1.1, standard_eval = TRUE) |>
  stub(vars = c("VAR", "LABEL"), "Variable", width = 2.5) |>
  define(VAR, blank_after = TRUE, dedupe = TRUE, label = "Variable",
         label_row = TRUE) |>
  define(LABEL, indent = .25, label = "Demographic Category") |>
  titles(`&titles.`, bold = TRUE) |>
  footnotes(`&footnotes.`)

# Add treatment groups
for (trt in names(trt_grps)) {
  tbl <- define(tbl, trt, label = trt_grps[trt], n = arm_pop[trt], standard_eval = TRUE)
}

# Create report
rpt <- create_report(o_path,
                     output_type = "&out_type.",
                     font = "Arial") |>
  page_header("Sponsor: &sponsor_name.", "Study: &study_name.") |>
  set_margins(top = 1, bottom = 1) |>
  add_content(tbl) |>
  page_footer("Date Produced: {toupper(fapply(Sys.Date(), '%Y%b%d'))}",
              right = "Page [pg] of [tpg]")

put("Write out the report")
res <- write_report(rpt&preview.)
In the above reporting code, notice the following:
- The code starts by setting a default output type of “RTF” if the
out_typevariable does not exist. The condition uses the%symexist()function to make that determination. - Definitions for the treatment group columns are created dynamically
from the
trt_grpsvariable. - Titles, footnotes, etc. are populated from the macro driver.
- The report functions come from the reporter package.
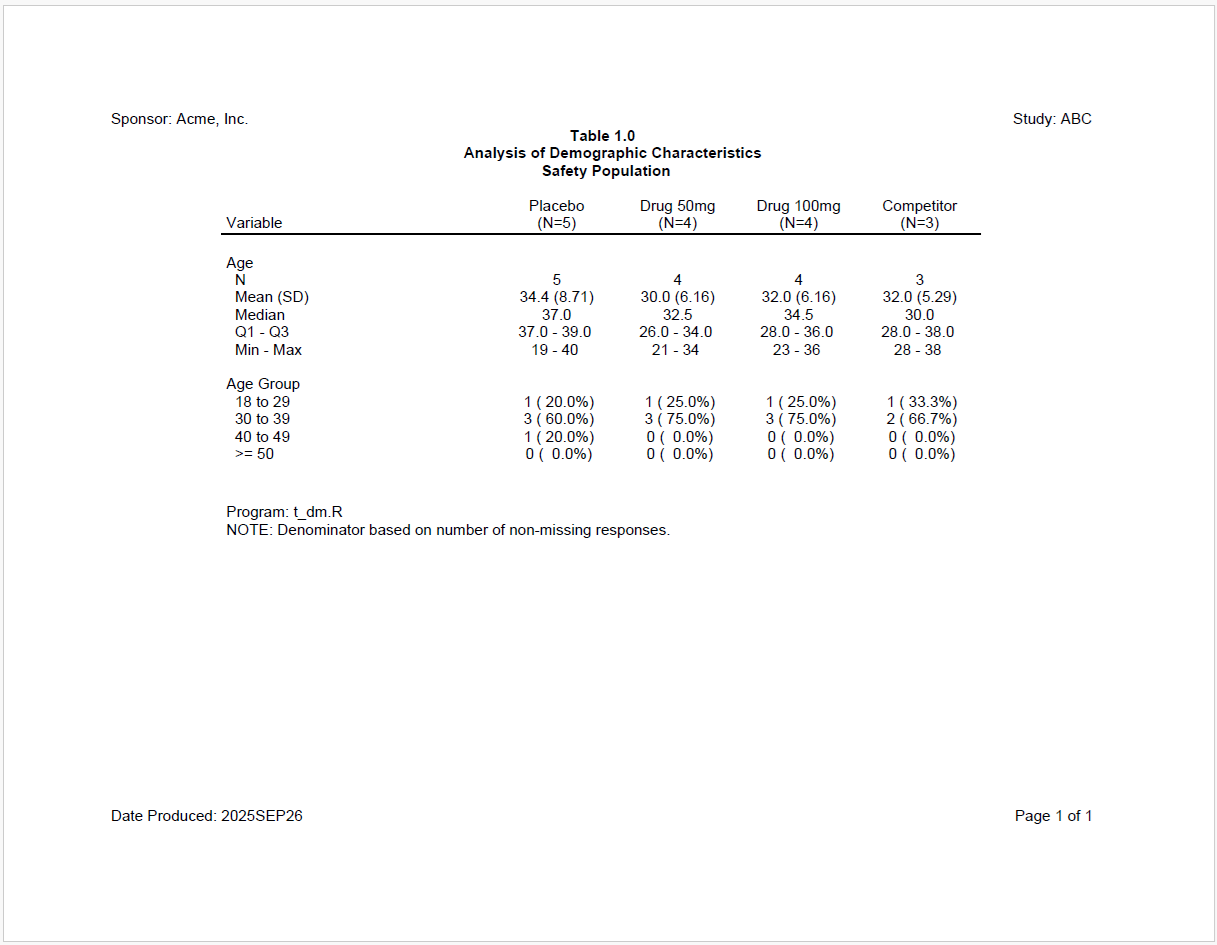
Generated Code
Upon execution of the call to msource(), the following
code will be generated:
#####################################################################
# Program Name: t_dm
# Study: ABC
#####################################################################

library(sassy)

# Prepare Log -------------------------------------------------------------


options("logr.autolog" = TRUE,
        "logr.on" = TRUE,
        "logr.notes" = FALSE,
        "procs.print" = FALSE)

# Assign program name
prog_nm <- "t_dm"

# Construct paths
l_path <- file.path("c:/packages/macro/tests/testthat/examples/log", paste0(prog_nm, ".log"))
o_path <- file.path("c:/packages/macro/tests/testthat/examples/output", prog_nm)

# Open log
lf <- log_open(l_path)

# Prepare formats ---------------------------------------------------------

sep("Prepare formats")

put("Compile format catalog")
fc <- fcat(MEAN = "%.1f", STD = "(%.2f)",
           Q1 = "%.1f", Q3 = "%.1f",
           MIN = "%d", MAX = "%d",
           CNT = "%2d", PCT = "(%5.1f%%)")


put("Age Groups")
fc$AGEG <- value(condition(x >= 18 & x <= 29, "18 to 29"),
                 condition(x >=30 & x <= 39, "30 to 39"),
                 condition(x >=40 & x <=49, "40 to 49"),
                 condition(x >= 50, ">= 50"),
                 as.factor = TRUE)


put("Sex decodes")
fc$SEX <- value(condition(x == "M", "Male"),
                condition(x == "F", "Female"),
                condition(TRUE, "Other"),
                as.factor = TRUE)


put("Race decodes")
fc$RACE <- value(condition(x == "WHITE", "White"),
                 condition(x == "BLACK OR AFRICAN AMERICAN", "Black or African American"),
                 condition(x == "ASIAN", "Asian or Pacific Islander"),
                 condition(x == "UNKNOWN", "Unknown"),
                 condition(TRUE, "Other"),
                 as.factor = TRUE)


# Load and Prepare Data ---------------------------------------------------

sep("Prepare Data")


put("Create sample data.")
dm <- read.table(header = TRUE, text = '
       SUBJID  ARM    SEX  RACE    AGE
       "001"   "ARM A" "F"  "ASIAN" 19
       "002"   "ARM B" "F"  "WHITE" 21
       "003"   "ARM C" "F"  "WHITE" 23
       "004"   "ARM D" "F"  "BLACK OR AFRICAN AMERICAN" 28
       "005"   "ARM A" "M"  "WHITE" 37
       "006"   "ARM B" "M"  "WHITE" 34
       "007"   "ARM C" "M"  "ASIAN" 36
       "008"   "ARM D" "M"  "WHITE" 30
       "009"   "ARM A" "F"  "WHITE" 39
       "010"   "ARM B" "F"  "WHITE" 31
       "011"   "ARM C" "F"  "BLACK OR AFRICAN AMERICAN" 33
       "012"   "ARM D" "F"  "WHITE" 38
       "013"   "ARM A" "M"  "BLACK OR AFRICAN AMERICAN" 37
       "014"   "ARM B" "M"  "WHITE" 34
       "015"   "ARM C" "M"  "WHITE" 36
       "016"   "ARM A" "M"  "WHITE" 40')


put("Log starting dataset")
put(dm)

put("Filter out screen failure")
dm_f <- subset(dm, ARM != 'SCREEN FAILURE')


put("Get ARM population counts")
proc_freq(dm_f, tables = ARM,
          output = long,
          options = v(nopercent, nonobs)) -> arm_pop

put("Log treatment groups variable")
trt_grps <- c('ARM A' = 'Placebo', 'ARM B' = 'Drug 50mg', 'ARM C' = 'Drug 100mg', 'ARM D' = 'Competitor')
put(trt_grps)


put("Categorize AGE")
dm_f$AGEG <- fapply(dm_f$AGE, fc$AGEG)


# Perform Analysis  -------------------------------------------------------


# Age Summary Block -------------------------------------------------------

sep("Create summary statistics for age.")

put("Call means procedure to get summary statistics for age")
proc_means(dm_f, var = AGE,
           stats = v(n, mean, std, median, q1, q3, min, max),
           by = ARM,
           options = v(notype, nofreq)) -> `stats_age`

put("Combine stats")
datastep(stats_age,
         format = fc,
         drop = find.names(stats_age, start = 4),
         {
           VAR <- "Age"
           `Mean (SD)` <- fapply2(MEAN, STD)
           Median <- MEDIAN
           `Q1 - Q3` <- fapply2(Q1, Q3, sep = " - ")
           `Min - Max` <- fapply2(MIN, MAX, sep = " - ")

         }) -> comb_age

put("Transpose ARMs into columns")
proc_transpose(comb_age,
               var = names(comb_age),
               copy = VAR, id = BY,
               name = LABEL) -> age_block


# Age Group Block ---------------------------------------------------------------

sep("Create frequency counts for Age Group")

put("Get ageg frequency counts")
proc_freq(dm_f,
          table = AGEG,
          by = ARM,
          options = nonobs) -> freq_ageg

put("Combine counts and percents and assign age group factor for sorting")
datastep(freq_ageg,
         format = fc,
         keep = v(VAR, LABEL, BY, CNTPCT),
         {
           VAR <- "Age Group"
           CNTPCT <- fapply2(CNT, PCT)
           LABEL <- CAT
         }) -> comb_ageg


put("Sort by ageg factor")
proc_sort(comb_ageg, by = v(BY, LABEL)) -> sort_ageg

put("Tranpose ageg block")
proc_transpose(sort_ageg,
               var = CNTPCT,
               copy = VAR,
               id = BY,
               by = LABEL,
               options = noname) -> ageg_block


# Sex Block ---------------------------------------------------------------

sep("Create frequency counts for Sex")

put("Get sex frequency counts")
proc_freq(dm_f,
          table = SEX,
          by = ARM,
          options = nonobs) -> freq_sex

put("Combine counts and percents and assign age group factor for sorting")
datastep(freq_sex,
         format = fc,
         keep = v(VAR, LABEL, BY, CNTPCT),
         {
           VAR <- "Sex"
           CNTPCT <- fapply2(CNT, PCT)
           LABEL <- fapply(CAT, fc$SEX)
         }) -> comb_sex


put("Sort by sex factor")
proc_sort(comb_sex, by = v(BY, LABEL)) -> sort_sex

put("Tranpose sex block")
proc_transpose(sort_sex,
               var = CNTPCT,
               copy = VAR,
               id = BY,
               by = LABEL,
               options = noname) -> sex_block


# Race Block ---------------------------------------------------------------

sep("Create frequency counts for Race")

put("Get race frequency counts")
proc_freq(dm_f,
          table = RACE,
          by = ARM,
          options = nonobs) -> freq_race

put("Combine counts and percents and assign age group factor for sorting")
datastep(freq_race,
         format = fc,
         keep = v(VAR, LABEL, BY, CNTPCT),
         {
           VAR <- "Race"
           CNTPCT <- fapply2(CNT, PCT)
           LABEL <- fapply(CAT, fc$RACE)
         }) -> comb_race


put("Sort by race factor")
proc_sort(comb_race, by = v(BY, LABEL)) -> sort_race

put("Tranpose race block")
proc_transpose(sort_race,
               var = CNTPCT,
               copy = VAR,
               id = BY,
               by = LABEL,
               options = noname) -> race_block

# Create final data frame -------------------------------------------------


final <- rbind(age_block, ageg_block, sex_block, race_block)

# Report ------------------------------------------------------------------


sep("Create and print report")


# Get min and max columns
mincol <- names(trt_grps[1])
maxcol <- names(trt_grps[length(trt_grps)])

# Create Table
tbl <- create_table(final, first_row_blank = TRUE) |>
  column_defaults(from = mincol, to = maxcol, align = "center",
                  width = 1.1, standard_eval = TRUE) |>
  stub(vars = c("VAR", "LABEL"), "Variable", width = 2.5) |>
  define(VAR, blank_after = TRUE, dedupe = TRUE, label = "Variable",
         label_row = TRUE) |>
  define(LABEL, indent = .25, label = "Demographic Category") |>
  titles(c('Table 1.0', 'Analysis of Demographic Characteristics', 'Safety Population'), bold = TRUE) |>
  footnotes(c('Program: t_dm.R', 'NOTE: Denominator based on number of non-missing responses.'))

# Add treatment groups
for (trt in names(trt_grps)) {
  tbl <- define(tbl, trt, label = trt_grps[trt], n = arm_pop[trt], standard_eval = TRUE)
}

# Create report
rpt <- create_report(o_path,
                     output_type = "PDF",
                     font = "Arial") |>
  page_header("Sponsor: Acme, Inc.", "Study: ABC") |>
  set_margins(top = 1, bottom = 1) |>
  add_content(tbl) |>
  page_footer("Date Produced: {toupper(fapply(Sys.Date(), '%Y%b%d'))}",
              right = "Page [pg] of [tpg]")

put("Write out the report")
res <- write_report(rpt, preview = 1)

# Clean Up ----------------------------------------------------------------
sep("Clean Up")

put("Close log")
log_close()


# Uncomment to view report
# file.show(res$modified_path)

# Uncomment to view log
# file.show(lf)
Observe that the generated code is clean and easy to read. Only the necessary lines from the template program are emitted during pre-processing.